Air Quality Research
Understanding the connections between highway construction and local air quality and local air quality.
Overview
Colorado is committed to promoting clean and healthy air for our citizens and visitors, protecting our scenic and natural resources, and promoting statewide greenhouse gas pollution abatement.
Transportation-related activities can be major contributors to local and regional air quality, and to greenhouse gas emission.
Vehicles produce significant amounts of particulate matter, nitrogen oxides, volatile organic compounds, carbon monoxide and other pollutants. Some emissions, such as vehicle tailpipe emissions and small particles kicked up by traffic, have received considerable research attention.
But impacts of construction and maintenance activities are less thoroughly studied.


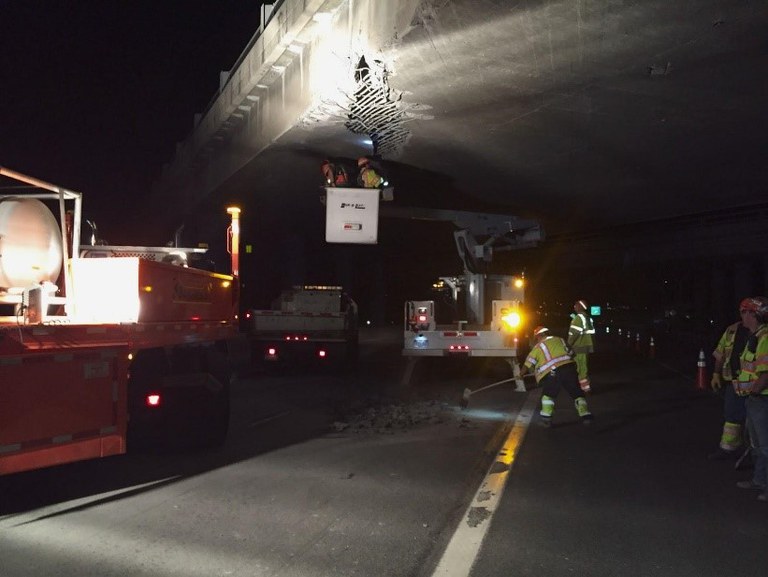
Although CDOT construction and maintenance takes place on highways, it can be very close to homes and businesses, sensitive ecological areas, and even near city centers. To deepen our understanding, CDOT’s Research Branch has made this topic an area of emphasis for our program. Beginning with the I-270 reconstruction project we will study the sources of pollutants, and how they move and dissipate.
This is a multi-year process because we need measurements before, during and after the construction. It is a difficult problem because there are many nearby emission sources that are unrelated to the highway. This study is just the first of several research projects we are planning around the state in settings with very different emissions, air flow and micrometeorology.
I-270 Air Quality Construction Research Project
CDOT is undertaking a research project along the I-270 corridor to observe and understand how construction activities affect nearby air quality. It is the first of several air quality research projects we expect to conduct during highway construction around the state.
The map below is a dashboard that provides near real-time air quality measurements collected for this research. Comparing these values with measurements away from the highway can indicate local air quality impacts of construction or sometimes of traffic. However, interpretation is complicated. Measurements are very close to the roadway, so they will be higher than diluted concentrations further downwind. Also, the I-270 corridor is in a complex emissions environment, with nearby industrial sources that are not related to the highway or construction.
Interactive Air Quality Dashboard
This is an interactive dashboard that shows the real time Air Quality Index (AQI) of four AQI measurement stations throughout Denver. The four stations are located at: (1) the intersection of I-270 and York Street, (2) the intersection of I-270 and Vasquez Boulevard, (3) a southeastern segment of US 550, and (4) a northwestern segment of US 550. The State of Colorado is committed to providing equitable access to our services to all Coloradans. For help using this dashboard, please contact the Research Branch team for accessibility assistance using this tool, or visit the CDOT accessibility webpage for more information and services.
The U.S. Environmental Protection Agency (EPA) has established air quality standards for pollutants that can be harmful to public health and the environment. For this project we are focusing on particulate matter (PM), and also some chemicals such as nitrogen dioxide (NO2) and sulfur dioxide (SO2) which are emitted by gasoline and diesel engines including by large construction equipment.
Ozone is also a concern. Although not emitted directly from engines, it forms from chemical reactions involving hydrocarbons, oxides of nitrogen and sunlight. We have installed seven measurement stations along I-270 and are using an additional array of nine movable stations to follow construction as it progresses. This array will be arranged for specific goals.
For example, it can measure pollutant concentrations at several distances and directions away from the highway. We are using three different instrument types for this project. Two sites will have very high-quality instruments that meet Federal Equivalent Method (FEM) accuracy and precision standards.
These are larger instruments at fixed sites, and they will anchor the research. The other sites will use two types of small, nimble sensors. Importantly, these nimble sensors are less expensive and easily movable. These sensors will be calibrated at the FEM sites, so we are confident in their measurements. Some sites will also measure wind speed and direction so we can interpret the movement and dispersion of pollutants.
The dashboard shows a current snapshot of the research station air quality measurements. You can click on a station to view more measurements and a few days of past data. You can also add stations from Colorado Department of Public Health and Environment (CDPHE), the City of Denver, and others. For information from reference sites across the state of Colorado you can check out this CDPHE site.
A basic measure of air pollution is the Air Quality Index (AQI). As described by AIRNOW, a product of the National Oceanographic and Atmospheric Administration.
“Think of the AQI as a yardstick that runs from 0 to 500. The higher the AQI value, the greater the level of air pollution and the greater the health concern. For example, an AQI value of 50 or below represents good air quality, while an AQI value over 300 represents hazardous air quality. For each pollutant an AQI value of 100 generally corresponds to an ambient air concentration that equals the level of the short-term national ambient air quality standard for protection of public health.
AQI values at or below 100 are generally thought of as satisfactory. When AQI values are above 100, air quality is unhealthy: at first for certain sensitive groups of people, then for everyone as AQI values get higher. The AQI is divided into six categories. Each category corresponds to a different level of health concern. Each category also has a specific color. The color makes it easy for people to quickly determine whether air quality is reaching unhealthy levels in their communities.”
This chart also comes from the AIRNOW site:
| Levels of Concern | Values of Index | Description of Air Quality |
|---|---|---|
| Good | 0 to 50 | Air quality is satisfactory, and air pollution poses little or no risk. |
| Moderate | 51 to 100 | Air quality is acceptable. However, there may be a risk for some people, particularly those who are unusually sensitive to air pollution. |
| Unhealthy for Sensitive Groups | 101 to 150 | Members of sensitive groups may experience health effects. The general public is less likely to be affected. |
| Unhealthy | 151 to 200 | Some members of the general public may experience health effects; members of sensitive groups may experience more serious health effects. |
| Very Unhealthy | 201 to 300 | Health alert: The risk of health effects is increased for everyone. |
| Hazardous | 301 and higher | Health warning of emergency conditions: everyone is more likely to be affected. |
Measurements at the CDOT sites along I-270 will be examined together with construction activities, traffic patterns, and more. They will also be compared with CDPHE measurement sites well away from the highway. Those sites can also be displayed on the dashboard.
The dashboard shows hourly measurements. CDOT researchers will have access to even better time resolution of just a few minutes so we can study changes during very dynamic local conditions. One example may be changes in traffic. During the morning or evening rush hour, how much higher is pollution? Some CDOT sites are equipped to measure wind speed and direction so we can account for changing wind patterns. Throughout the day, wind direction changes, sometimes very dramatically. With higher resolution data are we able to identify local emission sources more accurately than when looking only at daily averages or statistics?
With this rich dataset, researchers will try to understand air quality impacts of temporary construction activity such as digging or the presence of a lot of construction machinery. Together with CDPHE sites and other information we expect to differentiate between construction and other factors such as smoke from wildfires (near and far), atmospheric conditions such as inversions that trap and concentrate pollution close to the surface, and perhaps even industrial emissions.
Related research:
- The Near Road Study: From 2014 through 2019, the U.S. Department of Transportation conducted a study of air quality close to highways. Although the Near Road Study was not looking at the impact of construction activities, its results are useful to our CDOT research. You can find the Near Road Study here.
- Research in London studied construction activities and air quality between 2004 and 2008 for one project. The paper “Degradation in urban air quality from construction activity and increased traffic arising from a road widening scheme” describes this research.
Air Quality and Human Health:
- CDPHE’s website include a wealth of information on air quality and human health. See for example this excellent article.
The changing nature of National Ambient Air Quality Standards:
- Did you know that the Clean Air Act requires the National Ambient Air Quality Standard to be revisited on a regular cycle? For more information, check out the EPA website for more information on these rules.
Other CDOT Air Quality Measurements:
- CDOT has conducted air quality research before. For example, during the Central 70 construction project we monitored air quality near the Swansea Elementary School. We also operated several sites along I-70 from the Front Range into the mountains, and we will be adding measurement stations near Floyd Hill as a project there gets under way. Further, CDOT is required to model our project impacts – on air quality and other environmental conditions - as we prepare Environmental Impact Statements (EIS) for each major project.
