
Meeting Materials
Colorado Boulevard Bus Rapid Transit - Open House Materials
Open House | May 2026
This open house was for attendees to learn more about the project and provide feedback on proposed options for improvements along the corridor. The materials below are for review before and after the meeting:
- Board 1: Welcome (English) | Tablero 1: Bienvenida (en español)
- Board 2: Why BRT on Colorado Boulevard (English) | Tablero 2: ¿Por qué un BRT en Colorado Boulevard? (en español)
- Board 3: Project Overview (English) | Tablero 3: Resumen del proyecto (en español)
- Board 4: Project Timeline (English) | Tablero 4: Cronograma del proyecto (en español)
- Board 5: Potential BRT Stations (English) | Tablero 5: Posibles estaciones del BRT (en español)
- Board 6: Potential Corridor Improvements (English) | Tablero 6: Posibles mejoras en el corredor (en español)
- Board 7: Alternatives Analysis, Feasibility Screening (English) | Tablero 7: Análisis de alternativas, evaluación de viabilidad (en español)
- Board 8: Alternatives Analysis, Detailed Screening (English) | Tablero 8: Análisis de alternativas, evaluación detallada (en español)
- Board 9: Final Alternatives (English) | Tablero 9: Alternativas finales (en español)
- Board 10: Final Alternatives Screening Results (English) | Tablero 10: Resultados de la evaluación final de alternativas (en español)
- Board 11: Next Steps (English) | Tablero 11: Próximos pasos (en español)
- Board 12: Navigating the BRT (English) | Tablero 12: Navegando por el BRT (en español)
- Board 13: Community Outreach and Engagement (English) | Tablero 13: Alcance y participación comunitaria (en español)
- Board 14: Challenges on Colorado Boulevard, Lacking Amenities and Accessibility (English) | Tablero 14: Desafíos en Colorado Boulevard: falta de servicios y accesibilidad (en español)
- Board 15: Challenges on Colorado Boulevard, Safety (English) | Tablero 15: Desafíos en Colorado Boulevard: seguridad (en español)
- Board 16: Challenges on Colorado Boulevard, Transit Delay (English) | Tablero 16: Desafíos en Colorado Boulevard: retrasos en el transporte público (en español)
the Clayton Early Learning Center. The purpose of the open house was to gather feedback on
four proposed BRT alternatives for the corridor. More than 350 attendees joined the public
meeting, and 372 sticky note comments were placed on our project corridor map.
on April 29 and closed the survey on May 27. The project team collected 1,812 survey
responses. Please visit our Frequently Asked Questions page for frequently asked questions and answers about the Colorado Boulevard BRT Project.
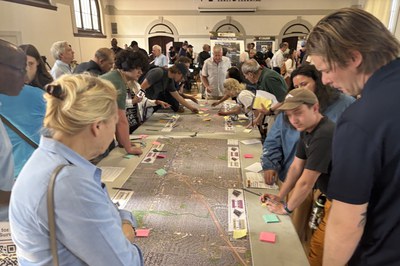
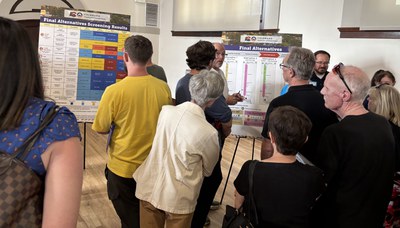
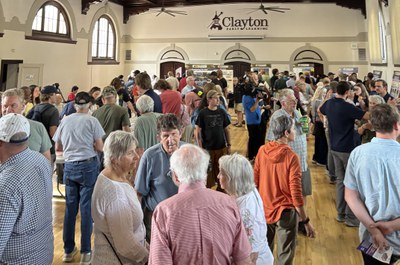
Project team members and public meeting attendees at the second Colorado Boulevard BRT public open house.
Survey Results
Here’s a recap of what we heard from our public meeting:
- How do you use the Colorado Boulevard corridor?
- The highest selected response was travel to other destinations (restaurants/shops etc.) (38%), followed by live near the corridor (32%), travel for work (21%) and travel for school
(6%). The least selected response was other (3%).
- The highest selected response was travel to other destinations (restaurants/shops etc.) (38%), followed by live near the corridor (32%), travel for work (21%) and travel for school
- Main Way of Travel on Colorado Boulevard (% of votes)
- The highest selected response was private vehicle (60%), followed by walk (12%), bicycle or
micromobility device (e-bike, e-scooter) (11%), public transit (local bus, regional bus,
FlexRide or Train) (11%), rideshare or transportation network company (Uber or Lyft) (6%)
and paratransit (Access-a-Ride) (>1%). The least selected response was other (<1%).
- The highest selected response was private vehicle (60%), followed by walk (12%), bicycle or
- Most Important Alternative Outcomes (% of votes)
- Respondents could select more than one answer choice, so the number of votes is higher than the number of respondents. Percentages may be rounded to the nearest whole number.
- The highest selected response was vehicle traffic impacts (19%), better corridor safety (14%), improved bus travel time (13%), enhanced pedestrian and bicycle connectivity (13%), higher transit ridership (12%), project cost (12%) and minimal property impacts (11%). The least selected response was low environmental impacts (historic properties, parks) (6%).
- According to your preference, rank the BRT alternatives for the Colorado Boulevard corridor.
- Respondents were able to, and at times did, select Least Preferred/Somewhat Preferred/Preferred/Most Preferred for multiple alternatives. Percentage votes are out of 100%.
- Alternative 1: Mixed Flow — 41% Least Preferred, 34% Somewhat Preferred, 17% Preferred and 8% Most Preferred.
- Alternative 2: Side Running — 30% Least Preferred, 23% Somewhat Preferred, 33% Preferred and 14% Most Preferred.
- Alternative 3: Center + Side — 46% Least Preferred, 5% Somewhat Preferred, 10% Preferred and 35% Most Preferred.
- Alternative 4: No Build — 43% Least Preferred, 6% Somewhat Preferred, 3% Preferred and 47% Most Preferred.
- Respondents were able to, and at times did, select Least Preferred/Somewhat Preferred/Preferred/Most Preferred for multiple alternatives. Percentage votes are out of 100%.
Open House | Sept. 12, 2024
- Board 1: Welcome (English) | Tablero 1: Bienvenida (en español)
- Board 2: What is the Colorado Boulevard BRT Project? (English) | Tablero 2: ¿Qué es el Proyecto BRT de Colorado Boulevard? (en español)
- Board 3: Project Timeline (English) | Tablero 3: Cronograma del proyecto (en español)
- Board 4: CDOT's 10-Year Plan (English) | Tablero 4: Plan de 10 años del CDOT (en español)
- Board 5: Why is BRT needed? (English) | Mesa 5: ¿Por qué es necesario el BRT? (en español)
- Board 6: Issues on Colorado Boulevard - Lacking Amenities and Accessibility (English) | Panel 6: Problemas en Colorado Boulevard: falta de servicios y accesibilidad (en español)
- Board 7: Issues on Colorado Boulevard - Safety (English) | Panel 7: Problemas en Colorado Boulevard - Seguridad (en español)
- Board 8: Issues on Colorado Boulevard - Transit Delay (English) | Panel 8: Problemas en Colorado Boulevard - Retraso en el tránsito (en español)
- Boards 9: What could BRT look like? Center Running and Side Running BRT (English) | Tablero 9: ¿Cómo podría ser el BRT? BRT de funcionamiento central y lateral (en español)
- Board 10: What could BRT look like? Enhanced Stations (English) | Tablero 10: ¿Cómo podría ser el BRT? Estaciones mejoradas (en español)
- Board 11: Thanks and Contact Information (English) | Tablero 11: Gracias e información de contacto (en español)
The Colorado Boulevard BRT Project’s first public open house was held on Thursday, Sept. 12, 2024 at the Hilton Garden Inn Denver/Cherry Creek. The purpose of the open house was to share information about the project and to connect with residents and community members to listen to their thoughts on project priorities and areas for improvement along the corridor. Almost 170 attendees joined the public meeting, and 192 public comments were placed on our project corridor map.
Additionally, a survey on the future of transportation on Colorado Boulevard was taken between Aug. 9 to Sept. 27 to gather additional feedback from members of the public on their experience of and priorities for Colorado Boulevard. The project team collected surveys from 600 individuals. Thank you to everyone who completed the survey and attended the open house!
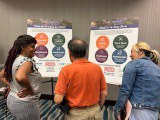

Project team members and public meeting attendees placing comments on the project corridor map.
Survey Results
Here’s a quick recap of what we heard from our public meeting:
- What method of travel do you most commonly use when in Denver?
- The highest selected response was private vehicle (48.1%), followed by bicycle or micromobility device (31.7%) and public transit (9.4%). The least selected response was rideshare or transportation network company (0.3%).
- How frequently do you currently use public transit (bus/train/FlexRide) in Denver?
- The highest selected response was weekly (30.8%), followed by rarely (26.7%) and monthly (24.3%). The least selected response was daily (7.3%).
- What type of trips do you take using transit in Denver?
- The highest selected response was recreation/leisure (30%), followed by work (20.8%) and transit connection (18.3%). The least selected response was tied school (3.3%) and other (3.3%).
- How do you typically access public transit stations/bus stops?
- The highest selected response was walk (55.6%), followed by private vehicle (15.8%) and bicycle or e-scooter (9.4%). The least selected response was other (0.6%).
- How often do you travel on Colorado Boulevard using any mode of transportation?
- The highest selected response was daily (39.4%), followed by weekly (32.3%) and monthly (19.2%). The least selected response was never (1.3%).
- What type of trips do you take on/using Colorado Boulevard?
- The highest selected response was recreation/leisure (24.2%), followed by shopping (24.1%) and work (13.5%). The least selected response was other (3.15%).
- Are you supportive of improved bus service along Colorado Boulevard?
- The highest selected response was strongly support (78.7%), followed by don’t support (9%) and moderately support (6.3%). The least selected response was little support (2.9%).
- What result(s) of an improved bus service is most important to you along Colorado Boulevard?
- The highest selected responses were tied buses running frequently (16.2%) and pedestrian improvements (16.2%), followed by buses running on time (13.5%) and roadway safety (12.9%). The least selected response was minimizing obstructions during construction (2.5%).
